
Technical Analysis
Technical analysis is a trading discipline employed to evaluate investments and identify trading opportunities by analyzing statistical trends gathered from trading activity, such as price movement and volume. Unlike fundamental analysis, which attempts to evaluate a security's value based on business results such as sales and earnings, technical analysis focuses on the study of price and volume.
Technical analysts believe past trading activity and price changes of a security can be valuable indicators of the security's future price movements. They use charts and other tools to identify patterns that can suggest future activity.
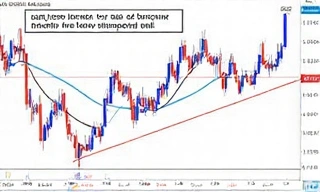
Moving Averages
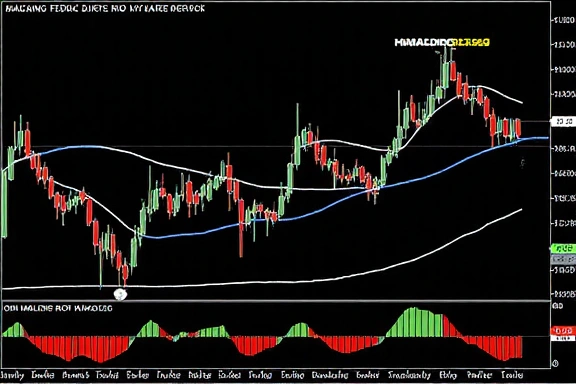
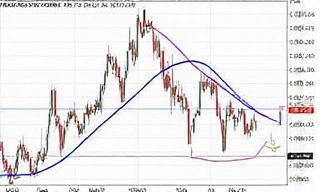
Moving averages smooth price data to create a single flowing line, making it easier to identify the direction of the trend. The most common types are simple moving averages (SMA) and exponential moving averages (EMA).
Relative Strength Index
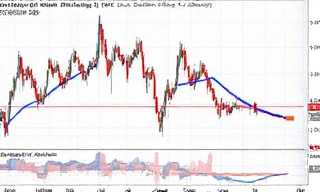
The RSI is a momentum oscillator that measures the speed and change of price movements. It oscillates between zero and 100, traditionally considered overbought when above 70 and oversold when below 30.
Bollinger Bands
Bollinger Bands consist of a middle band being a simple moving average with upper and lower bands that are standard deviations away from it. They help identify overbought or oversold conditions and measure volatility.
Fundamental Analysis

Fundamental analysis is a method of evaluating a security in an attempt to measure its intrinsic value by examining related economic, financial, and other qualitative and quantitative factors. Fundamental analysts study anything that can affect the security's value, including macroeconomic factors like the state of the economy and industry conditions, and microeconomic factors like the effectiveness of the company's management.
The end goal of fundamental analysis is to produce a quantitative value that an investor can compare with a security's current price, thus indicating whether the security is undervalued or overvalued.
Key Financial Metrics
- ✓ Earnings Per Share (EPS): Measures the profitability of a company
- ✓ Price-to-Earnings (P/E) Ratio: Compares a company's share price to its earnings
- ✓ Debt-to-Equity Ratio: Measures a company's financial leverage
- ✓ Return on Equity (ROE): Measures profitability relative to shareholders' equity
Qualitative Factors
- ✓ Business model and competitive advantages
- ✓ Management team quality and track record
- ✓ Industry growth potential and competitive landscape
- ✓ Regulatory environment and corporate governance
Risk Management
Risk management in trading is the process of identifying, analyzing, and accepting or mitigating uncertainty in investment decisions. Essentially, risk management occurs when an investor analyzes and attempts to quantify the potential for losses in an investment and then takes the appropriate action given their investment objectives and risk tolerance.
Proper risk management is what separates successful traders from those who fail. Even with the best trading strategy, without proper risk management, a trader can quickly lose their capital. The key principles include position sizing, setting stop-loss orders, and diversification.
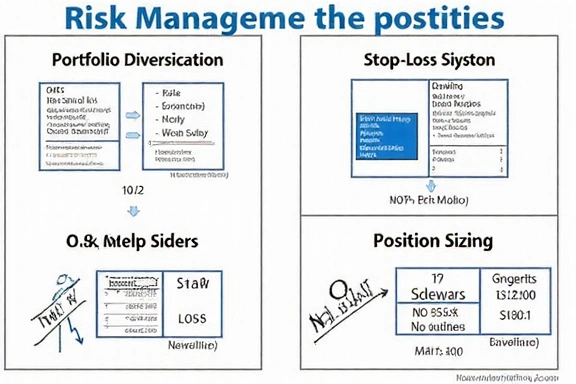
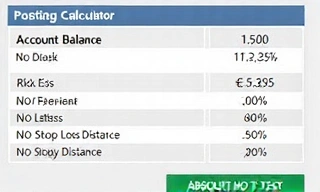
Position Sizing
Determining how much capital to allocate to a single trade based on your account size and risk tolerance. A common rule is to risk no more than 1-2% of your capital on any single trade.
Stop-Loss Orders
A stop-loss order is designed to limit an investor's loss on a security position. Setting stop-losses helps traders define their maximum loss per trade and removes emotion from trading decisions.

Diversification
Spreading investments across various financial instruments, industries, and other categories to reduce exposure to any single asset or risk. The goal is to maximize returns by investing in different areas.
Combining Methodologies

While technical and fundamental analysis are often viewed as competing approaches, the most successful traders frequently combine elements of both. Fundamental analysis can help identify undervalued assets with strong potential, while technical analysis provides precise entry and exit points.
For example, a trader might use fundamental analysis to select stocks with strong earnings growth and then use technical analysis to determine the optimal time to buy those stocks. Similarly, risk management principles should be applied regardless of the analysis method being used.
Our methodology teaches you how to integrate these approaches seamlessly, creating a comprehensive trading strategy that leverages the strengths of each method while mitigating their individual weaknesses.
Psychology of Trading
Trading psychology refers to the emotions and mental state that help dictate success or failure in trading securities. Trading psychology represents various aspects of an individual's character and behaviors that influence their trading actions. It can be as important as other attributes such as knowledge, experience and skill in determining trading success.
Discipline and risk-taking are two of the most critical aspects of trading psychology since a trader's implementation of these aspects is critical to the success of their trading plan. Fear and greed are commonly associated with trading psychology, while things like hope and regret also play roles in trading behavior.

Common Psychological Pitfalls
- ✗ Overtrading: Making too many trades due to excitement or trying to recover losses
- ✗ Confirmation Bias: Seeking information that confirms existing beliefs while ignoring contradictory evidence
- ✗ Anchoring: Fixating on specific price points regardless of changing market conditions
Developing the Right Mindset
- ✓ Maintain emotional equilibrium regardless of wins or losses
- ✓ Stick to your trading plan with discipline
- ✓ View trading as a probability game rather than needing to be right every time